By Firas Gara, Karol Szustakowski, João Melga
Abstract
The telecom-paris.fr website is a valuable source of information for incoming and enrolled students, but it is often considered quite hard to navigate by its users. As per our conducted research, which we will mention later, we have found out a very important fact: a lot of information is already there, but it is sometimes hard to access. The built-in search feature of the website works surprisingly well, but users rarely put trust into search bars on websites. This blogpost is also written during the time of rapid AI development, so we thought: why not propose an AI recommender system that points the user in the right direction on the website? Maybe we can analyze the path the user has already taken, where the user comes from (for example, the interests of international students might be different than French students’) and what time of the year the user accesses the website, and put together a system that predicts which page on the website the user should visit next.
Case-study description
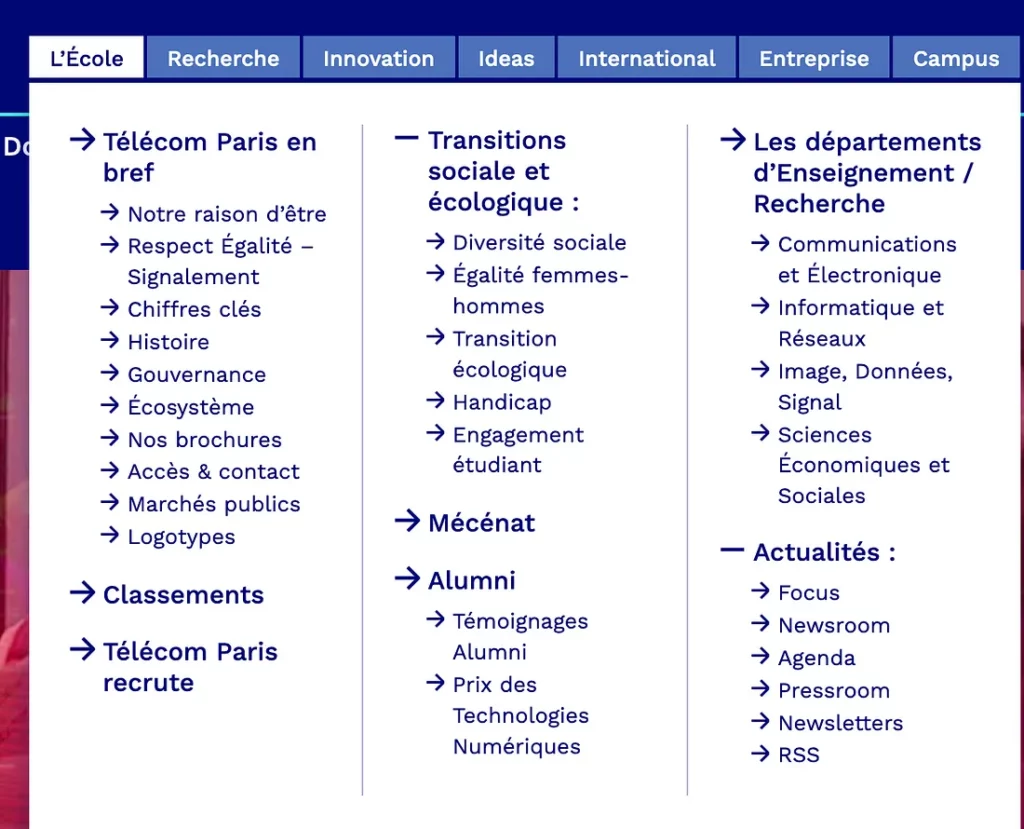
We are working with the Telecom Paris website, which is accessed by many students, professors and other interested people a day. The website itself already introduces multiple menus, sections and subsections. The menus themselves have a hierarchical structure, but it is easy to get lost, since we have two rows of menus, each one with many entries.
The important part that really plays a big role in this project is that we assume that the user visits multiple subpages during a visit, and that there is some logic behind the transitions to new subpages — maybe if a user first visits the “how to get to the school” page, he will later search for a “logement near the school” page, or some related information. This assumption lets us work with the later mentioned data in a predictive manner. An important part of the project is that we never had access to the source code of the website — only it’s logs, so part of our work was to figure out a way of modifying the website with our predictive navigation method that does not access the original web server in any way.
In-person interviews
In total, six people participated in our surveys which were to assess the usability of the website. The respondents generally agreed that they found the process realitvely streamlined for the Engineering program application, but encountered difficulty locating information on study costs. After navigating various tabs, they eventually found the relevant details.
Two out of six respondents spent more time on the “International” tab before realizing that the application details were under the Engineering section.
Responses from different participants regarding the intuitiveness of the website varied — some found it intuitive with minor suggestions for improvement, while others struggled with the menu structure. Opinions were also varied on the usefulness of the information presented on the homepage, with one respondent finding it irrelevant and another valuing the school rankings data. Suggestions for improving the website included simplifying the menu, making the colours more consistent and clarifying the information on available courses. Overall, respondents highlighted the need for clearer navigation and presentation of key details on the university website.
Qualitative analysis
In order to gather more general feedback on the current user experience at Telecom-Paris’ website, as well as insights into the potential impact of the first proposed navigation model, we created a qualitative survey. The main insights from the survey data are listed below with respective qualitative analysis.
We have asked some colleges from Telecom-Paris to answer the survey by publishing a link to it into several different Whatsapp groups. In these groups, there was a range of different profiles of students, varying from newly admitted ones until PhD attendees. After 1 week, we have got only 14 answers, which is, probably, due to the exams week that coincided with the survey. At first, we tried to identify how often our users interact with the website.

We could identify that our public is mostly either using the website a lot or not using it at all (“U-shaped” distribution).
The next step was to understand the different reasons our users were accessing the site. For that question, our team did the exercise of sketching the different macro use cases of the website according to its lifecycle through the different user-journeys. We thought about international students trying to find information before coming to France, French students willing to check the fees, etc.
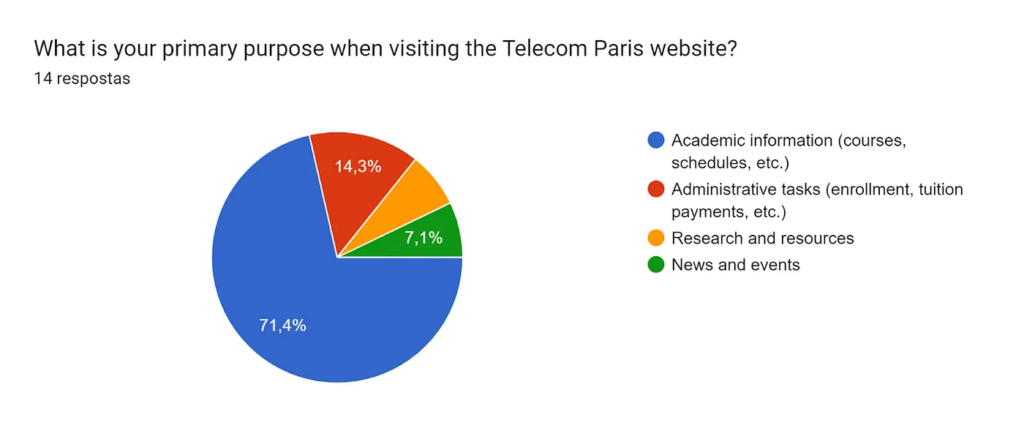
We found that most of the participants were using it to search for academic information (courses, schedules, etc.). Since we’re talking about a 14 person sample, it probably shows that our survey didn’t have the diversity of user profiles we were expecting. It’s not a problem per se, but it’s something to be attentive about while interpreting the rest of survey answers.
Now that we understood the frequency and purpose of our users, we tried to identify if they like or not the experience of surfing through the website.
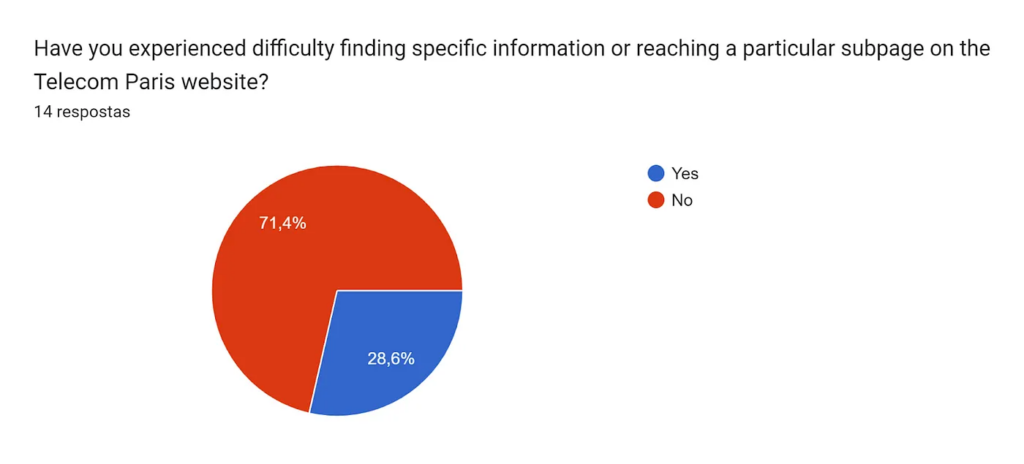

We found that an important parcel of the users were experiencing difficulties while surfing. In addition, half of them rated the current navigation either with 2 or 3, a range in which we could consider users are not so satisfied with the experience.
Finally, we managed to understand if users find predictive navigation somehow useful. And it seems that they do.

Quantitative analysis
The goal behind this quantitative analysis was to train a model capable of understanding the relationship between the different pages on the website and hence able to help users better navigate. A major part of the quantitative analysis was the data, so we will start with that.
Data Collection
For the model training, we rely on the past navigation logs on the Telecom Paris website, the data has been anonymized: the IP addresses of the users were replaced by other unique identifiers, and this led us to not take the location of the user into account.
Data Preprocessing
The raw data we were provided with was in the following format:

In these 6 columns, 3 are of actual importance to us:
- The unique identifier: AID
- The Timestamp
- The origin
The preprocessing of the data undergoes multiple steps:
Identifying a connection
This is the first step of the preprocessing, in which we want to identify the different connections to the website.
To do this we define a connection as the set of website pages visited by a single user at a specific lapse of time.
With this definition, we create a new data set containing the different connections.
Creating a navigation sequence
Once we have the connections, we retrieve from each connection the different pages visited and we sort them chronologically.
Hence we now have the navigation sequence that the user went through in his connection to the website.
Data encoding
A Machine Learning model is in general a mathematical model, that works better with numbers. But the data we now have is in text format. Hence we use a label encoder to turn data into integer format by giving each distinct string a unique identifier.
Preparing data for model training and testing
The data we now have is not data that a machine-learning model can understand and work with. For a supervised ML model, the data should be in the form of features-label pairs (X,y), where the features should be well identified and the label should be provided. But the sequences we have are potentially of different lengths.
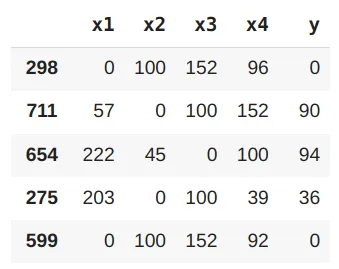
In our work, we choose to train our model with 4 features representing the 4 past visited pages, and the label is chosen to be the next page (i.e for a sequence of 5 pages ordered chronologically, the first 4 are used as features and the fifth is used as the label).
Model training and testing
Choosing the model
We consider 3 models as candidates to use in this machine learning task: Decision Tree, Random Forest Classifier, and XGBoost Classifier.
To identify the best candidate among these three and to determine the best hyperparameters to be used, we perform Grid Search with 10-fold cross-validation. Finally, we chose the Random Forest Classifier (with maximum depth = 5 and number of estimators = 200) as our model as it gave the best performance.
Training the model
The data sample that we have been provided with, to identify the model and test our source code is quite small. After preprocessing we extract 4000 samples from the data we have, which is not enough to get a reliable model.
The training has been done on a larger data set, with the help of Mr. Mavros, containing 50000 samples.
Testing the model
After training the model on the 50000 samples, we used the 4000 samples we have at our disposal to test it.
At first, we got a test accuracy of 0.48, such accuracy seems very good, yet we should be aware that there could be some biases in the data that lead to high accuracy. And indeed we a bias we found is that after the home page “/” we always find a path specifying the language of the navigation and it only takes 2 values “/en” or “/fr”.
Such information is not of much relevance to the user, hence we remove those pages to avoid biasing our model.
Finally, we find a test accuracy of 0.37. Which is still good, from a statistical point of view — as this is the top 1 accuracy, yet we can present multiple choices to the user to increase the usefulness of the system.
Website-model interaction
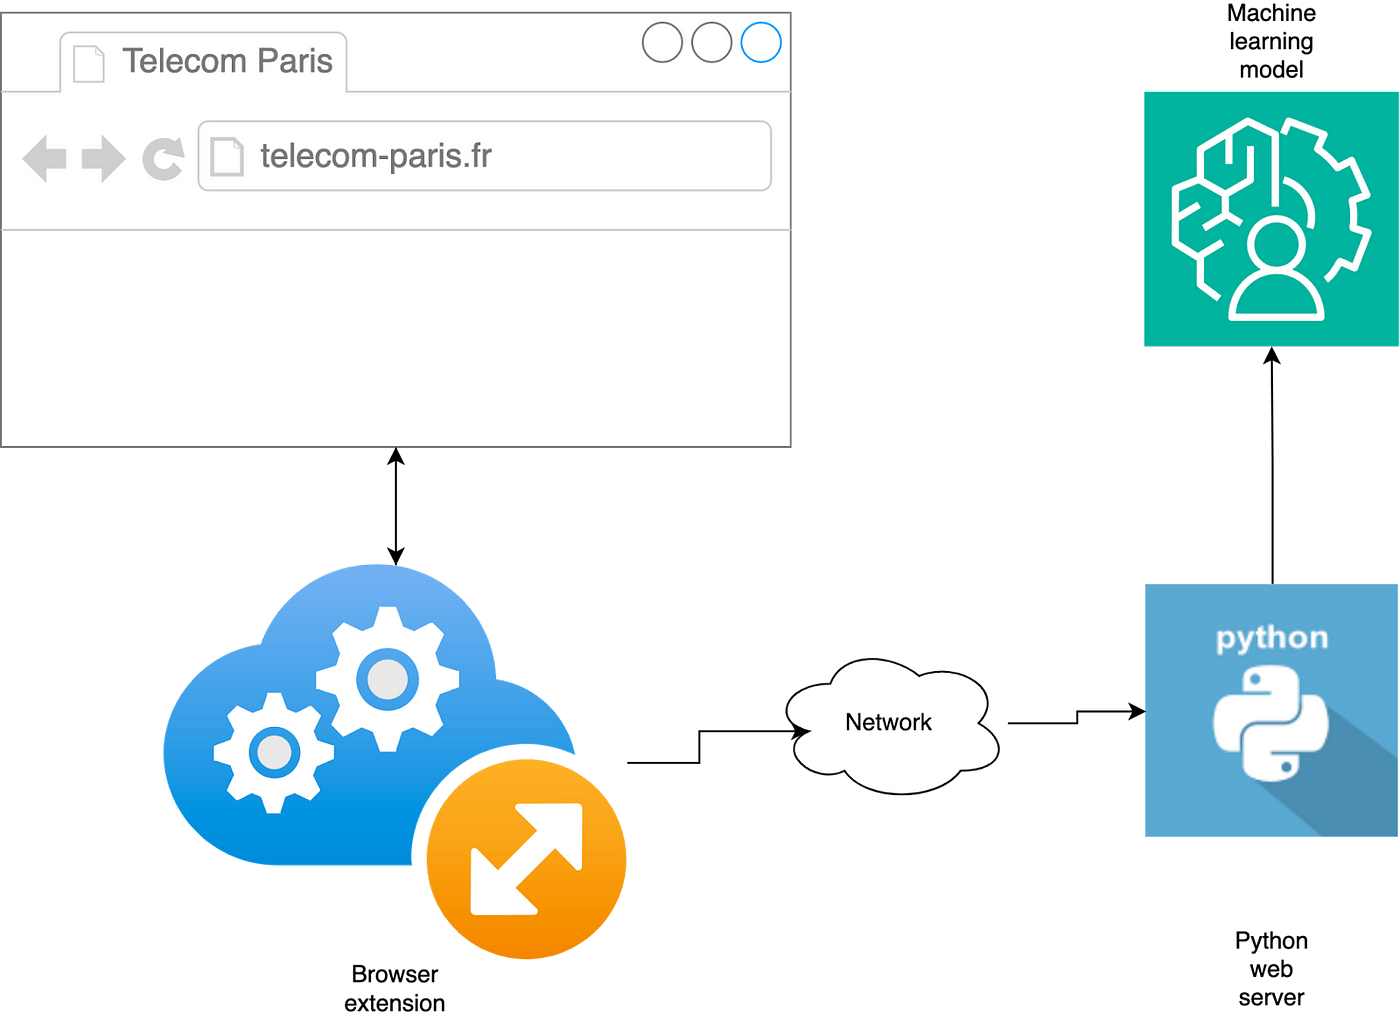
As previously mentioned, we had to come up with a way to inject our predictions to the website. We have solved this problem with a two-step approach. First, we have developed a browser extension which is able to interact with the browser, by injecting JavaScript code to the website, and tracking the subpages the user visits. This browser extension then sends a request to a python server each time the user visits a subpage of the website, and receives as a result the list of predicted next subpages to visit. The Python server is the one that actually runs the model and parses the data. Thanks to this solution, we can have many users contacting the same, centralized server. Therefore the users never store the model and the data used for training, helping us with preserving the GDPR.
The JavaScript part of the extension just adds yet another menu to the website, which is able to display all of our predictions. Below we show one such prediction on a live, running website.

Results
All the process performed by the group, since the problem discovery until the development and implementation of our AI recommender system, aimed to enhance user experience applying UX design techniques, serving as a laboratory for us as students. Through this “experiment” we obtained a spectrum of results, from the most tangible to the most abstract.
In practical terms, our machine learning model achieved a test accuracy of 37%. While this figure illustrates the model’s capability to predict future navigation paths based on previous user behavior, it also highlights the inherent challenges in accurately forecasting the highly variable patterns of human website interaction.
A crucial limitation of our project was the restricted opportunity to test the system extensively with real users. This limitation stemmed from a combination of factors, including time constraints and the logistical challenges of implementing a fully integrated testing phase within the project timeline. As a result, our understanding of the system’s effectiveness in real-world scenarios is somewhat limited, providing a narrower insight into its potential impact on enhancing the user experience.
But still, we could explore different facets of the challenges one could encounter when trying to enhance users’ experiences. For instance, some legal aspects forced us to bound even more our solution when it comes to training the model with real data coming from Telecom Paris website.
Insights and Recommendations
Our project journey offered insights into the intersection of machine learning, user experience design, and the practicalities of implementing technology solutions in real-world contexts. One of the most significant learnings from it was the critical importance of a balanced approach between technological development and user-centered design principles.
In our pursuit of an AI solution to improve website navigation, we inadvertently focused excessively on the solution, overlooking the comprehensive exploration of the problem space. This approach led to a somewhat superficial application of user experience (UX) techniques, limiting our ability to fully address the users’ needs and pains.
With the experience gained during that process, we recommend a more balanced approach that equally values problem exploration and solution development. It is essential to engage with real users early and often, gathering their feedback to iteratively refine the system. This process not only enhances the solution’s alignment with user needs but also ensures that the project does not veer too far into solutionism without adequately addressing the underlying issues it’s intended to solve.
Furthermore, now focusing on the specific solution itself, we recognize the need for continuous testing and adaptation of the model. The dynamic nature of website navigation and user behavior requires a model that can evolve over time. Future iterations of the project should include mechanisms for ongoing data collection and model retraining to adapt to changes in user interaction patterns.
In conclusion, while our project has laid the groundwork for using AI to enhance website navigation, the journey has underscored the importance of a balanced focus on both technology and user experience. By acknowledging the limitations of our initial approach, we pave the way for future projects to more effectively merge machine learning capabilities with deep, empathetic insights into user needs, ultimately leading to more meaningful technological solutions.